This article will talk about one type of flowchart, a data flow diagram or DFD. There are so many moving parts that go into an organization's systems and operations every day. Each is crucial to the success of a business or a project. With the proper techniques, it is difficult to track all the important details. DFD is used to graphically represent the flow of data in a business information system. That is why we introduce DFD with the best examples below.
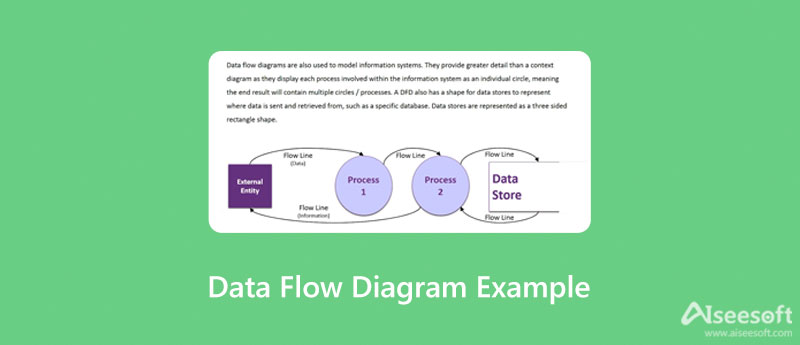
A data flow diagram or DFD is a graphic or visual representation. It uses a standardized set of symbols and notations to describe a project's operations during data movement. Data flow diagrams can be complex in design depending on the process. It may be a simple outline of a general system or a more granular structure with a multi-level procedure.
DFD visualizes the system flow with rectangles, circles, arrows, and short-text labels. They describe a system's information flow direction, data inputs and outputs, data storage points, and the sub-processes.
This type of flowchart was popular in the later 1970s and is based on the data flow graph computation models by David Martin and Gerald Estrin. Data flow diagrams can be divided into logical and physical. The former describes the flow of information through a system. The latter represents the implementation of the logical data flow.
There are four main components in a data flow diagram process:
According to the progress and details, a data flow diagram can be divided into level 0 to 1, 2, and beyond. We demonstrate data flow diagram examples based on levels and layers below:
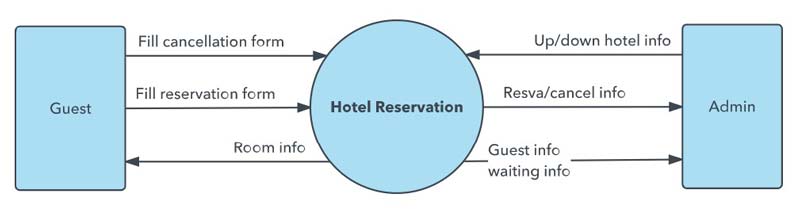
1. Data flow diagram level 0 is also called Context Diagram. It is a basic overview of a system or operation. It shows a system with a single process.
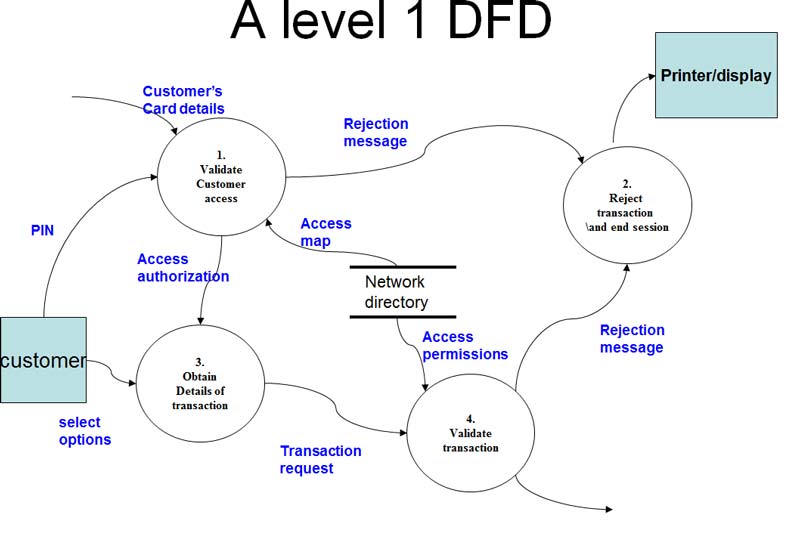
2. Data flow diagram level 1, also called Context Level Diagram, is used to highlight the main functions in a system.
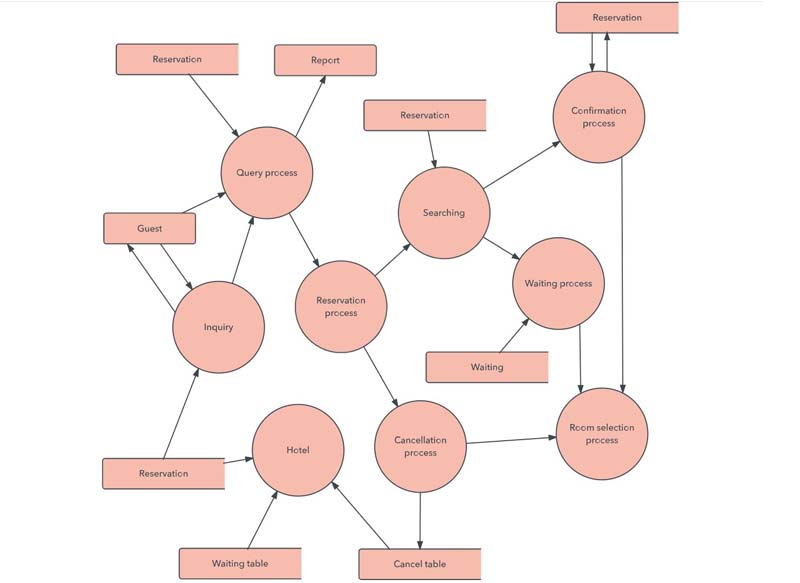
3. DFD level 2 is more complex than DFD level 1 and goes one step deeper. Plus, it requires more text to reach the details of a system.
4. DFD level 3, 4, and beyond are possible, but data flow diagrams level 3 is uncommon, not to mention higher levels.
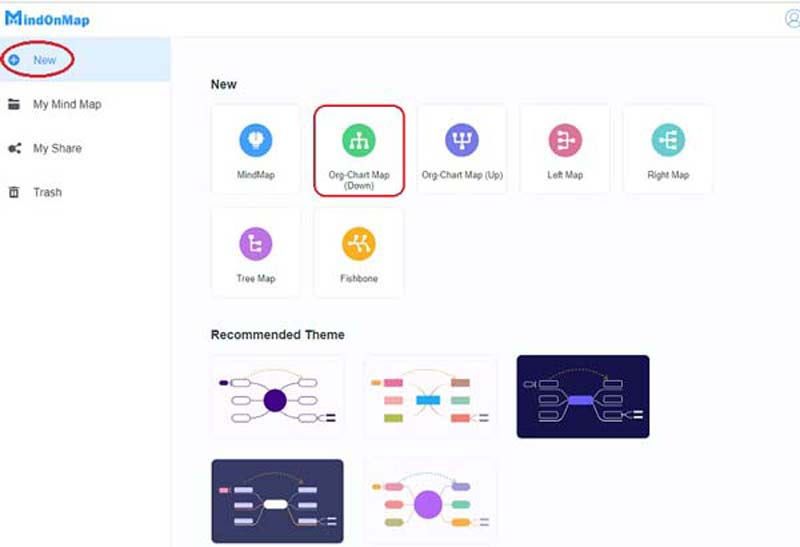
The easiest way to make a data flow diagram is MindOnMap. It is an online flowchart tool. One benefit is completely free to use. It means that you can make a data flow diagram without paying a penny. Moreover, it offers a variety of templates to simplify the workflow. Here are the steps below.


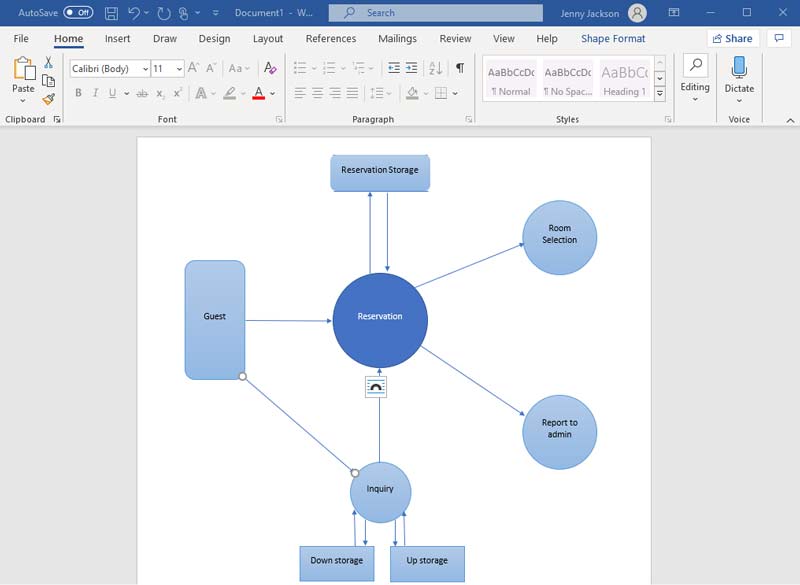
MS Word is another way to make a data flow diagram. Although it does not include templates, the shape library allows users to create diagrams manually using shapes, lines, arrows, and text.
Are data flow diagrams still used?
Yes, DFD is still used widely as a design tool when coding and analyzing projects.
How many symbols are used in a DFD?
DFDs only have four major symbols, entity, process, data store, and data flow. Therefore, users can easily understand the meaning.
What are the advantages of DFD?
It uses the graphical representation to help readers understand the functioning and systems easily. Since it only has four symbols, beginners can learn DFD quickly. It can provide a high level of system overview as well as the details of system components.
Conclusion
Based on our sharing, you should understand what is a data flow diagram and the best examples. More importantly, we demonstrate how to make a DFD online or using MS Word. If you just begin learning the diagram, you will find our guide helpful. Following the how-to, you can try making your own DFDs quickly. If you have other questions about DFD, please feel free to contact us by leaving a message below this post.
 What is Semantic Map and How to Make it [Examples Included]
Want to know the meaning of the semantic map? Don't know how to create a semantic map? You can find answers in this post and get some examples of semantic maps.
 What Is a Genogram and 3 Best Genogram Maker Recommendations
Does Word have a built-in genogram maker? What app can make a free genogram? Where to get genogram symbols and templates? This post answers all your questions.
 Top 3 Free Tree Diagram Makers to Create Your Tree Diagrams
What is the best tree diagram maker? How do you create a tree diagram? Can I make a tree chart online? Get 3 best tree diagram makers to make your tree diagram.

Video Converter Ultimate is excellent video converter, editor and enhancer to convert, enhance and edit videos and music in 1000 formats and more.
![]() 100% Secure. No Ads.
100% Secure. No Ads.
![]() 100% Secure. No Ads.
100% Secure. No Ads.
*Required field
*Please enter a valid email