Do you want to create a cause and effect diagram and search for a suitable example of a fishbone diagram?
In many cases, you will use fishbone diagrams. Creating a fishbone diagram can help analyze a problem's causes, process improvement, brainstorm new designs, and more. This post covers a fishbone diagram, some popular examples, and how to make a fishbone diagram.
Fishbone diagram, also known as the cause and effect diagram, Ishikawa diagram, Herringbone diagram, or Fishikawa diagram, is a visualization tool mainly used to categorize the root causes of a problem. With a fishbone diagram, you can easily make a root cause analysis. Fishbone diagram combines the practice of brainstorming using a mind map template.
A fishbone diagram can help you visually diagram a problem's root causes. With its help, you can truly diagnose the problem rather than focus on symptoms. In the successive layers, you may quickly figure out the root causes that potentially contribute to an effect. Moreover, a fishbone diagram lets you quickly sort your ideas into useful categories.
If you don't know how to start and make a fishbone diagram, you can check some popular fishbone diagram examples first. Plenty of fishbone diagram examples and templates offered on the internet can help you create cause and effect diagrams easily.
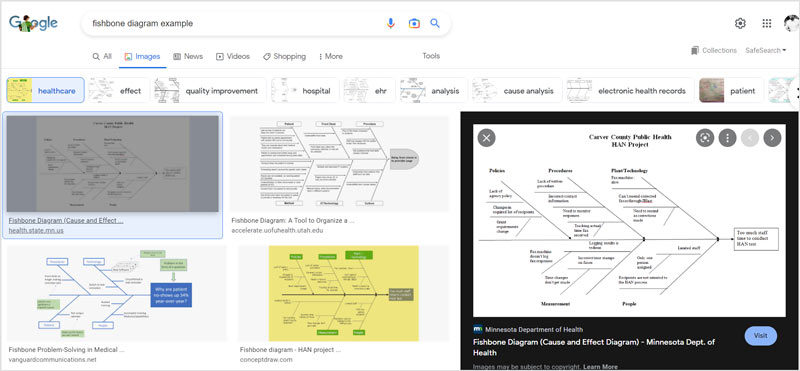
To quickly access commonly-used fishbone diagram examples, you can open your web browser like Chrome and search for them. You can get fishbone diagrams for healthcare, manufacturing, management, project, nursing, customer service, accident, blank fishbone diagram, and more from the search results.
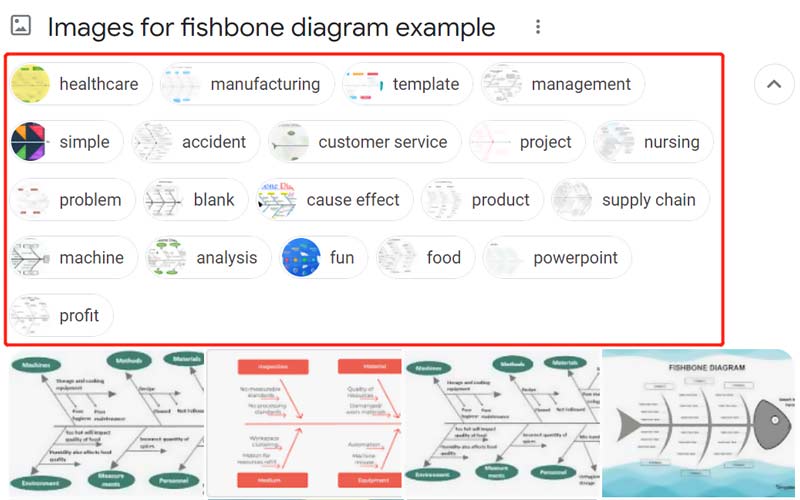
Click on the specific tab like healthcare, nursing, or quality improvement, and you will see more related images for the fishbone diagrams. Here you can scroll down to find a suitable example you like and then click on it to view more details. Save the diagram template picture on your device for later fishbone diagram creation.
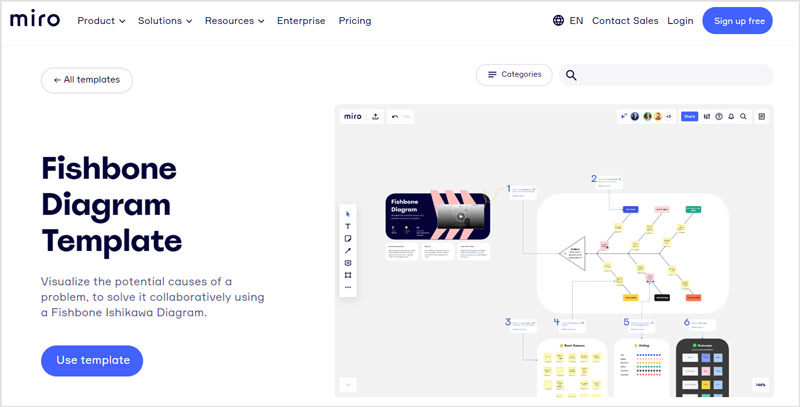
When looking for a suitable fishbone diagram example, you can also visit some visual collaboration platforms. Many ready-made templates are collected to help you create fishbone diagrams efficiently. Here you can go to the popular Miro to find some helpful fishbone diagram templates. When you get to its official website, you can click the top Product tab, choose Templates, and then scroll down to find Fishbone Diagram Template.
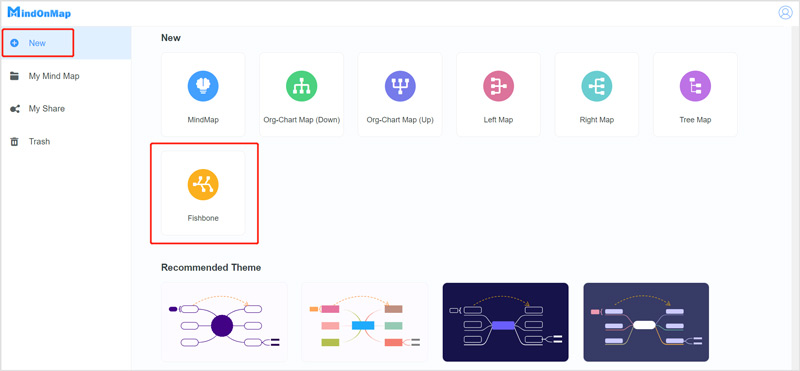
After you get a fishbone diagram example and want to make your cause and effect diagram, you can turn to the easy-to-use online fishbone diagram creator, MindOnMap. It is an all-featured mind mapping maker that can help you draw your ideas online visually. MindOnMap provides many valuable templates and examples to quickly start a fishbone diagram, flowchart, tree diagram, or organizational chart. You can follow the steps below to make a fishbone diagram directly on your browser.
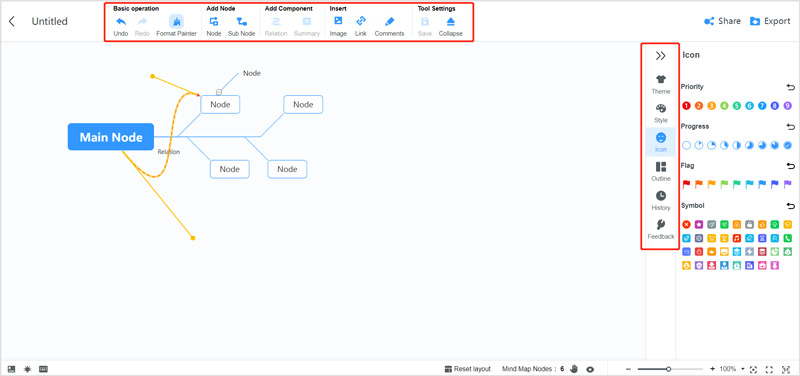
After adding nodes, you can immediately enter the text or information you need to insert. To quickly personalize your created fishbone diagram, you can click the Style option on the right-side panel and customize the fill color, shape, stroke color, and others.
Is there any fishbone diagram template offered in PowerPoint?
PowerPoint offers a shape library for you to create a fishbone diagram easily. You can open PowerPoint on your computer, click on the Insert tab, and then use its Shapes feature to make your diagram easily. But you should know that PowerPoint doesn't offer any ready-made fishbone diagram examples or templates for you.
How do you make a fishbone diagram in Excel?
When you want to create a fishbone diagram, you can open Excel on your computer, click on the top View tab, locate the Gridlines option, and then untick it. With these operations, you can turn the worksheet in Excel into a blank drawing page for creating a fishbone diagram. After that, you can click the Insert tab, click Shape, and choose the corresponding shapes from its drop-down list to start your diagram creation.
What is a fishbone diagram used for?
As mentioned above, you can consider using a fishbone diagram in many cases. For instance, when you want to make the root cause analysis and quickly identify the possible causes of a problem, develop a new product that addresses issues within current market offerings, put corrective actions into place to resolve an issue, reveal bottlenecks in the business process, and more. A fishbone diagram is mainly used to determine an underlying problem's cause and effect relationship and product development.
Is there any free fishbone diagram creator?
Many free fishbone diagram creators, including many online ones offered on the market, can help you make diagrams. If you don't know which one you should use, you can try the famous fishbone diagram makers like Lucidchart, Canva, SmartDraw, EdrawMax Online, or Miro's fishbone diagram creator. Also, you can rely on pre-installed software like Microsoft Excel or PowerPoint to free make a fishbone diagram.
Conclusion
Creating a cause and effect fishbone diagram is quite helpful for analyzing the root cause(s) of a problem. This post has mainly discussed a fishbone diagram, frequently-used fishbone diagram examples, and how to make your fishbone diagrams. For more questions about the fishbone diagram, you can leave us a message in the comment part.
 5 Best and Commonly-used Flowchart Makers Online & Offline
What is the flowchart? How to create a flowchart by myself? Which flowchart maker should I choose for making a flowchart? You can find answers in this post.
 6 Best Free Bubble Map Makers to Increase Your Productivity
Here is everything you need to know about the bubble map and the 6 best free bubble map makers to help you better organize ideas.
 Introduction to Nursing Concept Map and the Best Map Maker
How to make a nursing concept map? Here is a detailed introduction to it and the useful concept map maker with nursing concept map templates.
Video Converter Ultimate is excellent video converter, editor and enhancer to convert, enhance and edit videos and music in 1000 formats and more.
![]() 100% Secure. No Ads.
100% Secure. No Ads.
![]() 100% Secure. No Ads.
100% Secure. No Ads.
*Required field
*Please enter a valid email