What is a PERT chart? You must have heard this term so often if you constantly deal with project management. To better answer this question, this article presents you with every detail you should know about the PERT Chart including the definition, function, comparison with Gantt Chart, and a free PERT chart maker. Meanwhile, if you are also a beginner in this chart, the step-by-step guide here will be helpful to you. Then, without further ado, move along to see more.
Prepare yourself with a comprehensive introduction to the PERT chart. Because here you are about to see every aspect that is related to the PERT chart. Buckle up and scroll down to continue reading.
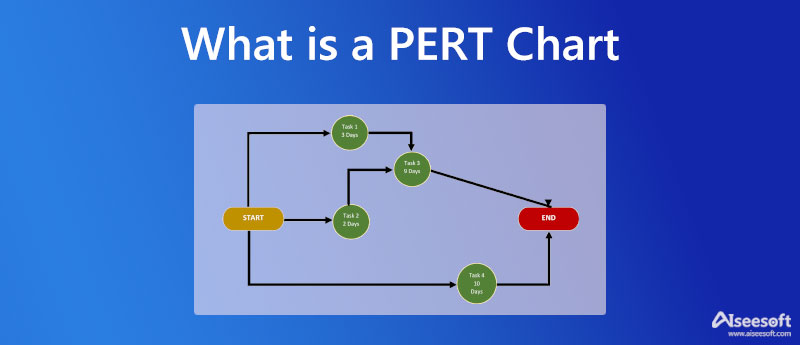
PERT chart stands for Program or Project Evaluation Review Technique. PERT chart is a statistical tool used in project management to line out and track the tasks and duration of a certain project, Normally, it is used by project managers to assign tasks. Moreover, when drawing such a chart, the schedule of a project is necessary while the details and duration of each task can be left out.
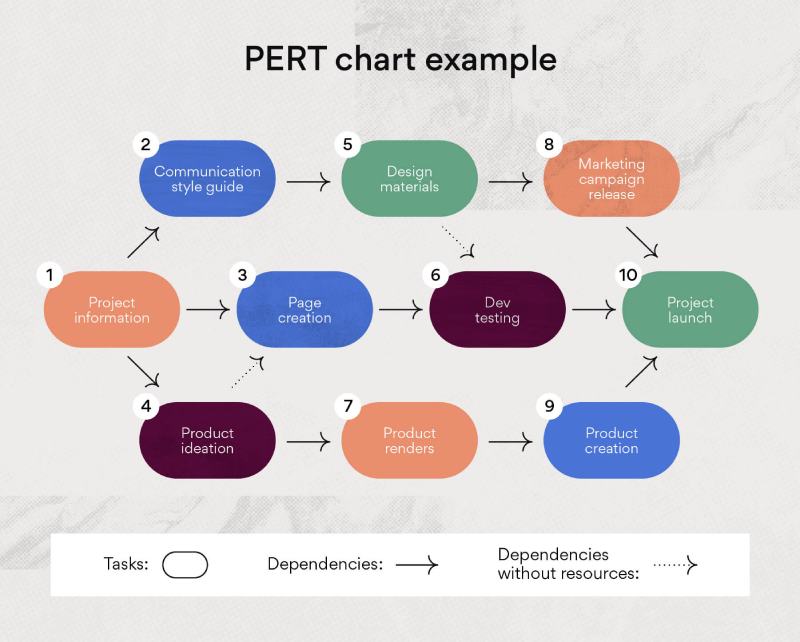
If you want to learn more about the PERT chart definition, you should not miss the comparison between the PERT chart and the Gantt chart. These two may both be used frequently in task management, and both offer a visual representation of a project schedule. There are some differences in structure, task dependency, and flexibility.
Check the chart below to see more.
| PERT Chart vs Gantt Chart | |||
| Structure | Visual Presentation | Flexibility | |
| PERT Chart | The PERT chart is a free-form chart. There is no fixed rule for the shape of nodes in the chart. The layout also varies for different people. | The PERT chart display task clearly while the evaluation of resource is also easy. The task relations are also easy to tell since the structure is not fixed. | Less flexible than the Gantt chart once changes happen to the mid-project. |
| Gantt Chart | Gantt chart has a linear format with a timeline and the length of each bar represents the duration of each task. | Gantt chart has a clear presentation due to the linear layout. But if the project gets complex, the Gantt will be long, and hard to find the task dependency. | If the project changes while going on, it is easy to change the Gantt chart since it offers more options. |
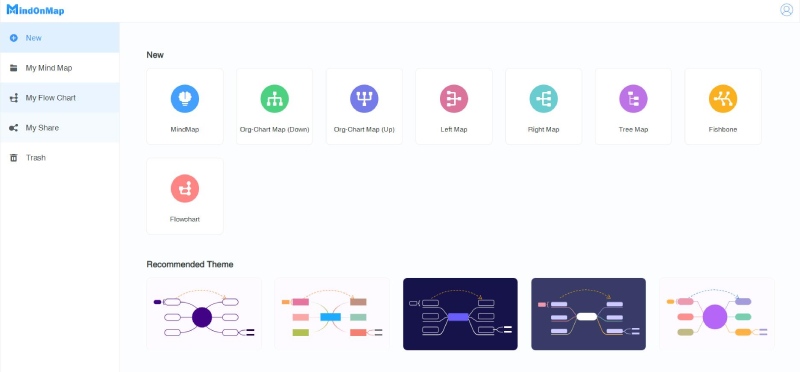
Before creating a PERT chart, here are something for you to do. First, you need to specify a project and all the tasks in it. Because this will give you a clear theme when drawing the chart. Now you just need a handy PERT chart maker like MindOnMap to help you start from scratch or start with the colorful templates in this free diagramming tool. Additionally, the auto-save feature in this tool can prevent you from any accidental data loss. Meanwhile, this PERT chart maker allows only your friends to check your work if you sent them the link with passwords.

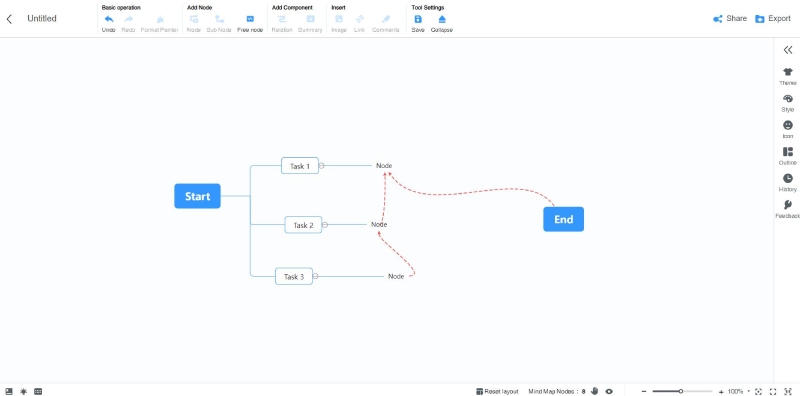
After you finish drawing the PERT chart, you can also share this chart for others to review by clicking the Share button to create a link. Moreover, this free maker will not put any watermark on your work and save you the trouble of removing the watermark.
What is the purpose of the PERT chart?
Through the PERT chart, you can better see how much time you have spent on a certain task, and if there is any irrelevant task getting in the way that postpones the finishing time. So next time, when dealing with a new project, you will know how to improve your work efficiency.
What are the 6 steps in planning a PERT chart?
To set up a PERT chart, here are the 6 necessary steps to remember: specify the project and timeline, figure out the sequence for each task, construct a basic structure, estimate the possible time for tasks, determine the critical path, and update the PERT chart as the project goes on.
How to make a PERT chart in Excel?
Launch Excel and go to the Insert tab to pick up the shapes you want to use as the nodes in the chart. Then, place these shapes in your blank sheet and enter the tasks' names. Repeat these until you fill in all the shapes. Next, use the connectors from Lines to connect each task. Once you connect them all, then the chart is finished.
Conclusion
Through the comprehensive introduction to the PERT chart, you now surely have a better understanding of the PERT chart definition along with how to draw it online. Next time, if you need to analyze a certain project and assign tasks, it will be much easier to set up a vivid chart of your own with this free diagramming tool.
 5 Best and Commonly-used Flowchart Makers Online & Offline
What is the flowchart? How to create a flowchart by myself? Which flowchart maker should I choose for making a flowchart? You can find answers in this post.
 What Is Organizational Chart and 5 Best Org Chart Creators
Is there free org chart software? How do you create an organizational chart? Check the organizational chart definition and get 5 best org chart creators here.
 Stakeholder Mapping and How to Create a Stakeholder Map
What is stakeholder mapping? What are the advantages of stakeholder mapping? How to make stakeholder mapping and analysis? This post answers your questions.

Video Converter Ultimate is excellent video converter, editor and enhancer to convert, enhance and edit videos and music in 1000 formats and more.
![]() 100% Secure. No Ads.
100% Secure. No Ads.
![]() 100% Secure. No Ads.
100% Secure. No Ads.
*Required field
*Please enter a valid email